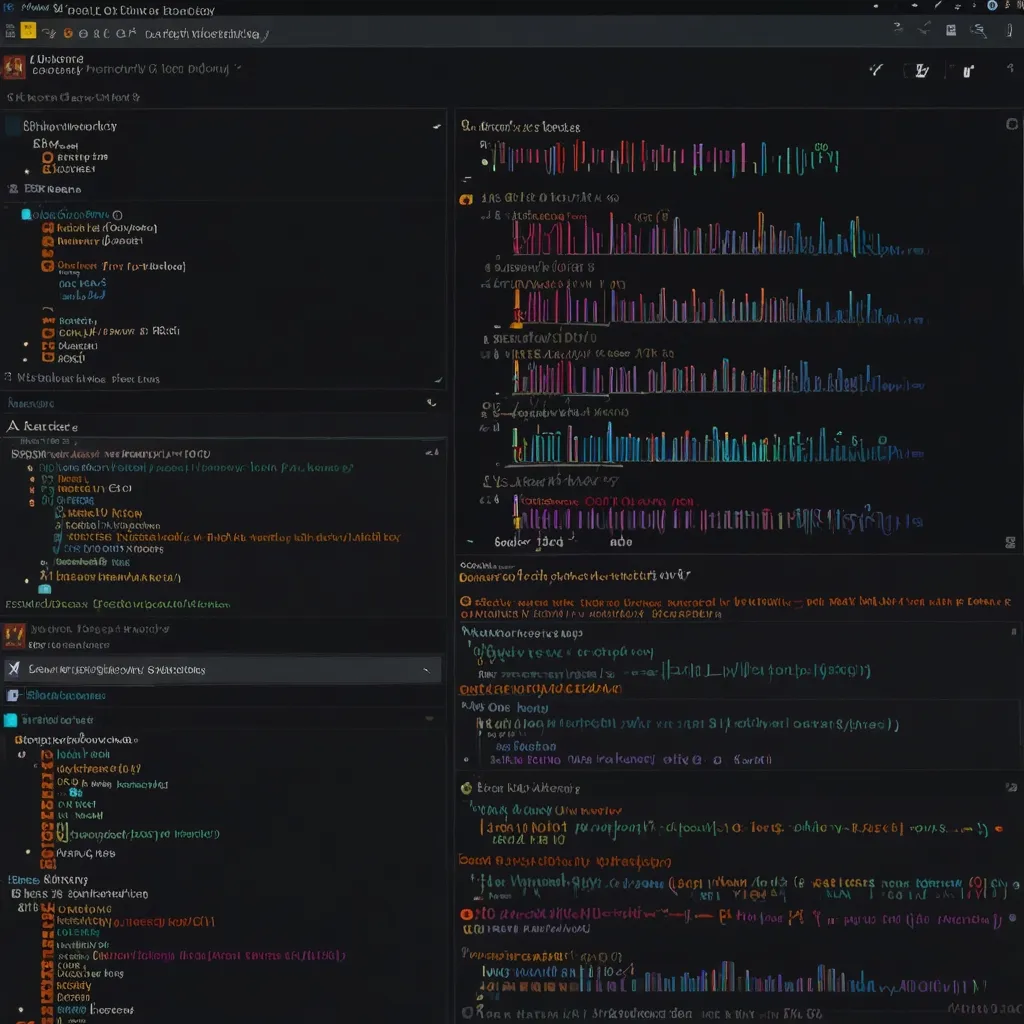
Alright, let’s chat about making programs run smoother with code profiling. Think of it like tuning up your car but for software. When your app’s performance starts to lag or gobble up too much memory, profiling tools can help you figure out what’s slowing things down and how to fix it.
What’s Code Profiling Anyway?
So, code profiling is like checking under the hood of your application. These tools track your program’s habits, like how much time it spends on tasks or how much memory it’s eating up. This way, we can find out where things get sluggish and start making tweaks right away.
Profiling Types: What’s The Difference?
When it comes to profiling, we’ve got two main types: instrumentation and sampling. Let’s break them down.
Instrumentation Profilers shove in extra code to keep tabs on performance. It’s super detailed but can slightly mess with how your program runs because, well, it’s doing extra work just to watch itself. Think of it as a detective following someone around – very informative but not super subtle. gprof in C++ is one such detective, showing us exactly how long each function takes.
Sampling Profilers peek at your program at regular intervals to see what’s up. Less nosy than instrumentation and less likely to nudge your program out of its natural rhythm. This method is great for getting a bird’s-eye view without a ton of overhead. Tools like cProfile for Python or VisualVM for Java are good examples here.
Profiling Step-by-Step
Here’s a simple roadmap to get profiling:
Start by setting up a test environment that’s basically a mini-version of your live setup. We want performance surprises but in a safe playground, right?
Next, replicate the issue you’re seeing. If your app slows down when handling lots of users, mimic that scenario.
Choose the right tool for the job. Depending on your programming language, this could be gprof for C++, VisualVM for Java, or others tailored to your environment.
Time to run the profiler! Let it collect data on what’s going on when your app is running.
Dive into the results. Look for functions or methods that are hogging resources or dragging their feet. Anything that’s running long or using too much memory could be your bottleneck.
Based on what you find, start optimizing. This could be cutting down unnecessary function calls, tweaking algorithms, or being smarter about memory use.
Profiling Example with C++
Imagine you’ve got a C++ server app that’s crawling under heavy load. Here’s a peek at a simple profiling session:
Consider this bit of code:
#include <iostream>
#include <vector>

// This function could be your bottleneck
void slowFunction(std::vector<int>& data) {
    for (int i = 0; i < data.size(); ++i) {
        data[i] = data[i] * data[i];
    }
}

int main() {
    std::vector<int> data(1000000);
    for (int i = 0; i < data.size(); ++i) {
        data[i] = i;
    }

    // Call the potentially slow function
    slowFunction(data);

    return 0;
}
To profile it with gprof, you’d compile it with profiling flags:
g++ -pg -o myprogram myprogram.cpp
Run your program:
./myprogram
Generate the report:
gprof myprogram gmon.out > profiling_results.txt
Then, comb through the report to spot time-sucking functions like slowFunction. Fixing it might involve optimizing the logic inside or maybe parallelizing it to use multiple cores.
The Perks of Profiling
Code profiling offers a bunch of benefits:
-
Smoother Performance: Identifying and fixing bottlenecks can make your app run faster and more efficiently.
-
Shorter Dev Cycles: Spot issues early on, nip them in the bud, and save time down the line.
-
Better Resource Management: Learn how your app uses CPU and memory, allowing for smarter resource allocation.
-
Cleaner Code: Profiling often leads to streamlined, better-quality code since you’re fixing performance issues by refactoring.
-
Improved User Experience: Faster apps mean happier users who don’t have to wait around.
-
Cost Savings: Less need for major overhauls post-launch, reducing long-term maintenance costs.
Profiling Best Practices
To get the most out of your profiling efforts, keep these tips in mind:
Always profile in environments that mimic production as closely as possible. This gives you a more accurate picture of what needs fixing.
Use a mix of profiling tools. No single tool will give you the complete story; combine tools to get a fuller picture.
Profile regularly. Don’t wait until things go wrong; make profiling a routine part of your development cycle.
Dive deep into the profiler results. The numbers can tell you a lot if you just take the time to look closely.
Optimize based on what you learn. Target your fixes where the profiler shows the most problems to get the biggest performance boosts.
By making profiling a regular part of your workflow, your apps will be faster, more reliable, and offer a better experience for users. No matter your language of choice—be it C++, Java, Python, or something else—the right profiling tools and techniques can help you spot and squash those pesky performance issues efficiently and effectively.


